


The 2019 RISC OS Survey
This survey was run by RISCOSitory on the RISC OS Awards website, alongside the awards poll covering the same year. Apart from the initial receipt of the entries being on a Linux computer, all processing was carried out on an ARMX6 running RISC OS, using some internal software along with Fireworkz, PipeDream, Draw, Artworks2 and ConvImgs.
The idea of combining a survey with an annual awards poll should, in theory, provide a picture of how the RISC OS community looks, and allow developers and companies involved in the RISC OS platform to keep what they offer relevant - especially considering that it is an undeniable fact that the number of RISC OS users is low in the extreme.
As mentioned in the Awards results, the number of valid votes this year was just 102, which is one of the lowest so far.
Not everybody who voted in the Awards Poll completed the survey part of the form - leaving the default "I'd rather not say" option ticked instead - and some people left that option selected for some questions. That means no question saw a full 102 people answer it, and some questions saw fewer answers than others. The results are based only on those who offered an answer to each question.
The third column in each table is the number of percentage points the result has changed by since the previous year.
The 2019 RISC OS Survey Results
Question 1: How many RISC OS systems do you own?
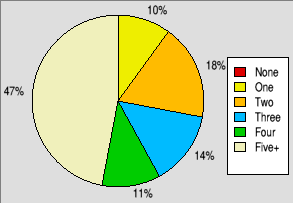
Typical numbers of RISC OS computers owned.
| Number | Percentage | Change |
|---|---|---|
| None | 0% | -1% |
| One | 10% | -2% |
| Two | 18% | -3% |
| Three | 14% | +2% |
| Four | 11% | -6% |
| Five+ | 47% | +10% |
Question 2: And of those, how many are in regular or semi-regular use?
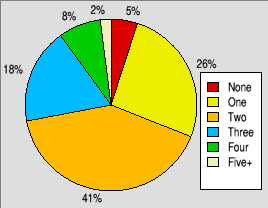
Typical numbers of RISC OS computers in use.
| Number | Percentage | Change |
|---|---|---|
| None | 5% | -3% |
| One | 26% | -15% |
| Two | 41% | +8% |
| Three | 18% | +5% |
| Four | 8% | +3% |
| Five+ | 2% | +2% |
Question 3: Which version of RISC OS do you use most?
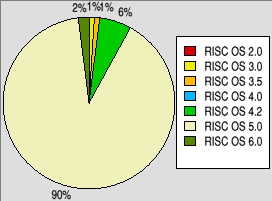
The most used versions of RISC OS.
| Version | Percentage | Change |
|---|---|---|
| RISC OS 2.0 | 0% | - |
| RISC OS 3.0 | 1% | -2% |
| RISC OS 3.5 | 1% | -1% |
| RISC OS 4.0 | 0% | -3% |
| RISC OS 4.2 | 6% | -1% |
| RISC OS 5.0 | 90% | +9% |
| RISC OS 6.0 | 2% | -2% |
Question 4: What is your main platform for using RISC OS?
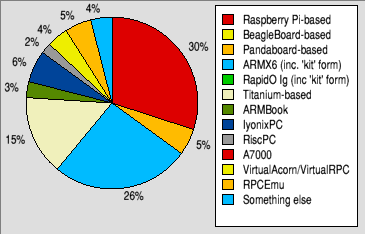
The platforms used most for RISC OS.
| Platform | Percentage | Change |
|---|---|---|
| Raspberry Pi-based | 30% | -7% |
| BeagleBoard-based | 0% | -3% |
| Pandaboard-based | 5% | +2% |
| ARMX6 (inc. 'kit' form) | 26% | +6% |
| RapidO Ig (inc. 'kit' form) | 0% | -1% |
| Titanium-based | 15% | -1% |
| ARMBook | 3% | +3% |
| IyonixPC | 6% | +3% |
| RiscPC | 2% | -3% |
| A7000 | 0% | - |
| VirtualAcorn/RiscPC | 4% | -1% |
| RPCEmu | 5% | -1% |
| Other | 4% | +3% |
Question 5: How long have you been a RISC OS user?
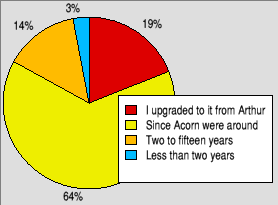
How long people have been RISC OS users.
| How long | Percentage | Change |
|---|---|---|
| I upgraded to it from Arthur! | 19% | -2% |
| Since Acorn were around | 64% | -3% |
| Two to fifteen years | 14% | +6% |
| Less than two years | 3% | -1% |
Question 6: Do you use RISC OS in a professional capacity in any way?
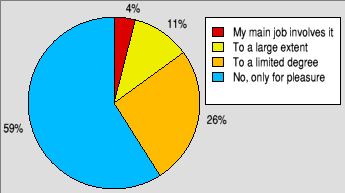
Breakdown of the use of RISC OS
in a professional capacity.
| Degree of professional use | Percentage | Change |
|---|---|---|
| My main job involves RISC OS | 4% | +1% |
| Not just RISC OS, but to a large degree | 11% | -1% |
| Only to a limited degree | 26% | +9% |
| No, I only use it for pleasure | 59% | -9% |
Question 7: Would you say your overall use of RISC OS has increased or decreased over the last year?
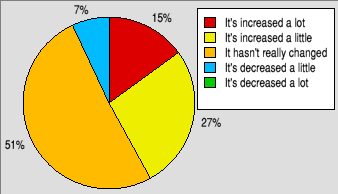
Breakdown of whether people's use of RISC OS has increased or decreased.
| Increase/decrease in use | Percentage | Change |
|---|---|---|
| It's increased a lot | 15% | +4% |
| It's increased a little | 27% | +7% |
| It hasn't really changed | 51% | -3% |
| It's decreased a little | 7% | -4% |
| It's decreased a lot | 0% | -4% |
Question 8: How much would you say you've spent on RISC OS hardware in the last year?
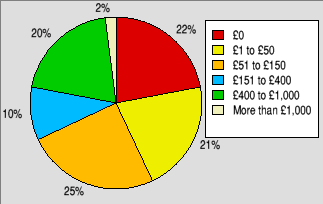
Breakdown of how much people think they've spent on hardware.
| Estimated spend | Percentage | Change |
|---|---|---|
| £0 | 22% | -8% |
| £1 to £50 | 21% | +1% |
| £51 to £150 | 25% | +2% |
| £151 to £400 | 10% | -5% |
| £401 to £1,000 | 20% | +10% |
| More than £1,000 | 2% | - |
Question 9: How much would you say you've spent on RISC OS software in the last year?
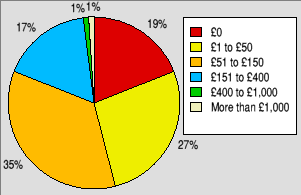
Breakdown of how much people think they've spent on software.
| Estimated spend | Percentage | Change |
|---|---|---|
| £0 | 19% | -7% |
| £1 to £50 | 27% | -1% |
| £51 to £150 | 35% | -3% |
| £151 to £400 | 17% | +9% |
| £401 to £1,000 | 1% | +1% |
| More than £1,000 | 1% | +1% |
Question 10: How much do you think you'll spend on RISC OS hardware this year?
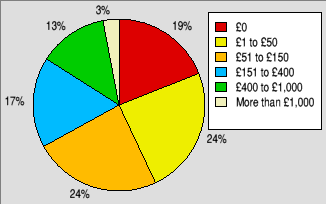
Breakdown of how much people think they'll spend on hardware.
| Anticipated spend | Percentage | Change |
|---|---|---|
| £0 | 19% | -12% |
| £1 to £50 | 24% | +13% |
| £51 to £150 | 24% | +3% |
| £151 to £400 | 17% | -5% |
| £401 to £1,000 | 13% | -2% |
| More than £1,000 | 3% | +3% |
Question 11: How much do you think you'll spend on RISC OS software this year?
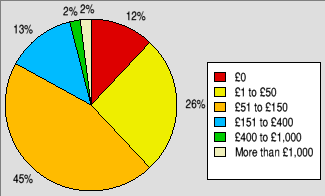
Breakdown of how much people think they'll spend on software.
| Anticipated spend | Percentage | Change |
|---|---|---|
| £0 | 12% | -2% |
| £1 to £50 | 26% | -2% |
| £51 to £150 | 45% | -4% |
| £151 to £400 | 13% | +4% |
| £401 to £1,000 | 2% | +2% |
| More than £1,000 | 2% | +2% |
Question 12: If you feel your spending is low, why would you say that is?
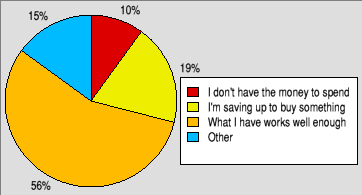
Breakdown of why people felt their spending was low.
| Reasons given (from options) | Percentage | Change |
|---|---|---|
| I don't have the money to spend | 10% | -5% |
| I'm saving up to buy something | 19% | +7% |
| What I have works well enough | 56% | +2% |
| Other | 15% | -4% |
Accompanying this question was a text field for people who chose 'other' to offer a reason if none of the existing options covered (or was close enough to) their reasons. In some cases, people chose the 'other' option and didn't offer a reason, and in some cases the reason they gave was fairly close to the existing options. Those that didn't correspond closely to an existing option were variations on:
- To spend money, there must be things I want to buy.
- Nothing worth buying that isn't free elswhere.
- I only buy software when upgrades appear and hardware when it needs to be replaced.
- I have other priorities.
- I'm retired.
- I don't use RISC OS much, so can't justify spending.
- I build what I need.
Question 13: Do you attend your local user group meetings?
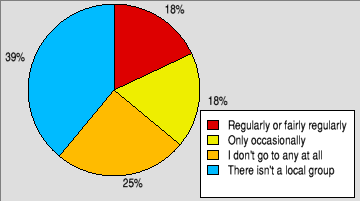
Breakdown whether people attend user group meetings.
| Meeting attendance | Percentage | Change |
|---|---|---|
| Regularly or fairly regularly | 18% | -1% |
| Only occasionally | 18% | +10% |
| I don't go to any at all | 25% | - |
| There isn't a local group | 39% | -9% |
Question 14: If not, do you know of a local group and if/when they meet?
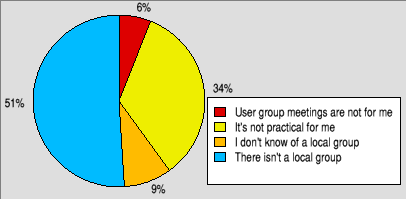
Why people don't attend local user group meetings
| Reason for non-attendance | Percentage | Change |
|---|---|---|
| Meetings aren't for me | 6% | -2% |
| It isn't practical for me | 34% | +18% |
| I don't know if there's a local group | 9% | -8% |
| There isn't a local group | 51% | -8% |
Question 15: By choice, do you use any platforms other than RISC OS?
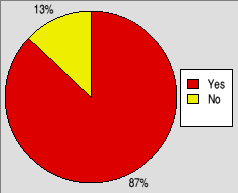
Whether people choose to use
another OS as well as RISC OS
| Yes or no | Percentage | Change |
|---|---|---|
| Yes | 87% | +1% |
| No | 13% | -1% |
Question 16: What operating system(s) do you use as well as RISC OS?
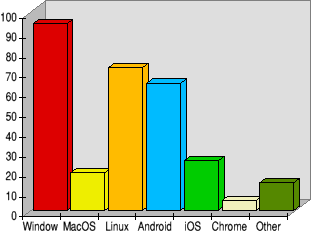
The range of operating systems used alongside RISC OS
| OS | Percentage | Change |
|---|---|---|
| Windows | 94% | +10% |
| MacOS | 19% | -10% |
| Linux | 72% | +14% |
| Android | 64% | -2% |
| iOS | 25% | -2% |
| ChromeOS | 5% | +4% |
| Other | 14% | +5% |
Question 17: Which other operating system do you use most?
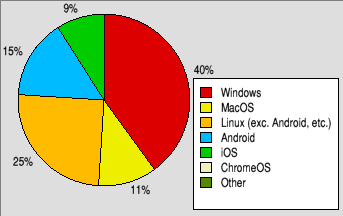
The other OS most used by choice.
| Most used other OS | Percentage | Change |
|---|---|---|
| Windows | 40% | +1% |
| MacOS | 11% | -4% |
| Linux | 25% | -5% |
| Android | 15% | +3% |
| iOS | 9% | +5% |
| ChromeOS | 0% | - |
| Other | 0% | - |
Question 18: On what processor do you use that operating system?
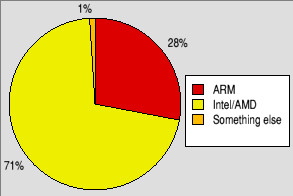
The processors used for the other
operating system.
| Processor used | Percentage | Change |
|---|---|---|
| ARM | 28% | +7% |
| Intel/AMD | 71% | -4% |
| Other | 1% | -3% |
Question 19: And do you use it more than RISC OS?
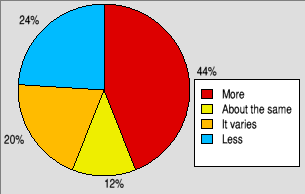
Is that other OS used more or less than RISC OS?
| Amount used | Percentage | Change |
|---|---|---|
| More than RISC OS | 44% | -6% |
| About the same | 12% | -10% |
| It varies | 20% | +10% |
| Less than RISC OS | 24% | +6% |
Question 20: In which age range do you fall?
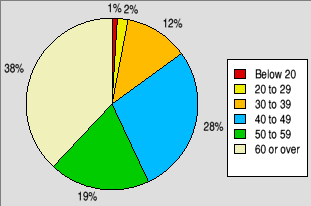
The age of RISC OS users.
| Age range | Percentage | Change |
|---|---|---|
| Below 20 | 1% | +1% |
| 20-29 | 2% | +1% |
| 30-39 | 12% | -1% |
| 40-49 | 28% | -3% |
| 50-59 | 19% | +1% |
| 60 or over | 38% | +1% |
Question 21: What gender are you?
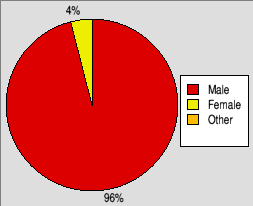
The genders of RISC OS users
| Gender | Percentage | Change |
|---|---|---|
| Male | 96% | -2% |
| Female | 4% | +2% |
| Other | 0% | - |