


The 2013 RISC OS Survey
This was the first survey run by RISCOSitory on the new RISC OS Awards website, alongside the 2012/2013 awards poll. Apart from the initial receipt of the entries being on a Windows computer, the original processing was carried out on a Raspberry Pi running RISC OS, using Fireworkz, Draw, Artworks2, and ConvImgs. The pie charts have since been updated on an ARMX6, using PipeDream, Draw, Artworks2, and ConvImgs, and the way the numbers have been presented has also been changed.
The idea of combining a survey with an annual awards poll should, in theory, provide a picture of how the RISC OS community looks, and allow developers and companies involved in the RISC OS platform to keep what they offer relevant - especially considering that it is an undeniable fact that the number of RISC OS users is low in the extreme.
With that in mind, as mentioned in the Awards results, the number of people who voted in the awards and took part in the survey was notably low, at just under 150. Given the size of the RISC OS community, and that this is the first attempt by RISCOSitory to do such a thing, this isn't an especially discouraging result, and it is certainly a reasonable starting point to build upon in future years.
However, when reading these results, do consider that the number of survey results completed is low enough that it may not be statistically representative. This is particularly true if you consider that there are some distinct groups of people who may not have been aware of the survey, and so didn't take part as a result.
The common attribute amongst those groups of people - the reason they may not have been aware of the awards poll and survey - is that they may not read, or even be aware of, the various forums and newsgroups many of us use on a regular basis, and even take for granted; the comp.sys.acorn newsgroups, mailing lists such as Archive-on-Line, the RISC OS Open Ltd forums, and so on. They may not read the forums and newsgroups for any one or more of a number of reasons:
- Perhaps their system 'just works' and they just get on with things, for example, which might be true for any number of people who have been using RISC OS for many years.
- Maybe it's because they only read those forums and newsgroups that they consider relevant to their particular systems and how they use them, which might be true of VirtualRiscPC owners, for example, perhaps reading only the VirtualAcorn forums.
- Or there may be new users, who have come to the platform through simply trying out RISC OS thanks to its easy availability on platforms such as the Raspberry Pi, but who have yet to discover the regularly used RISC OS discussion forums.
Having spoken to a small number of people at shows in the past who fall into these groups, it seems unlikely that they are the only ones; it is reasonable to believe that there may be many more like them - as well as other groups of people who, for whatever reason, may not have known about the survey.
Update (August 2020): As noted above, the way the results are presented has been changed. Firstly, the various charts, following a change of procedure in subsequent years; these are now produced from PipeDream, rather than Fireworkz, because it seems to generate smaller images but with slightly larger text. Secondly, the percentages have now been rounded, rather than shown to two decimal places. And thirdly, the various options and percentages are now presented in tables, which makes them easier to read. Finally, the accompanying text has been removed from each option.
The 2013 RISC OS Survey Results
Question 1: How many RISC OS systems do you own?
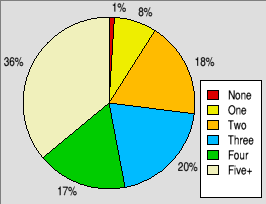
Typical numbers of RISC OS computers owned.
| Number | Percentage |
|---|---|
| None | 1% |
| One | 8% |
| Two | 18% |
| Three | 20% |
| Four | 17% |
| Five+ | 36% |
Question 2: And of those, how many are in regular or semi-regular use?
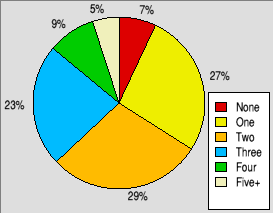
Typical numbers of RISC OS computers in use.
| Number | Percentage |
|---|---|
| None | 7% |
| One | 27% |
| Two | 29% |
| Three | 23% |
| Four | 9% |
| Five+ | 5% |
Question 3: Which version of RISC OS do you use most?
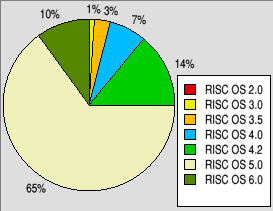
The most used versions of RISC OS.
| Version | Percentage |
|---|---|
| RISC OS 2.0 | 0% |
| RISC OS 3.0 | 1% |
| RISC OS 3.5 | 3% |
| RISC OS 4.0 | 7% |
| RISC OS 4.2 | 14% |
| RISC OS 5.0 | 65% |
| RISC OS 6.0 | 10% |
Question 4: What is your main platform for using RISC OS?
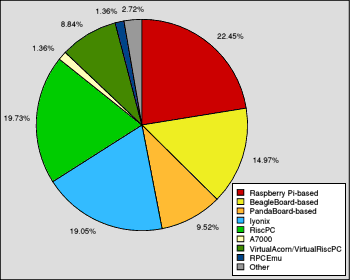
The platforms used most for RISC OS.
| Platform | Percentage |
|---|---|
| Raspberry Pi-based | 22% |
| BeagleBoard-based | 15% |
| Pandaboard-based | 10% |
| IyonixPC | 19% |
| RiscPC | 20% |
| A7000 | 1% |
| VirtualAcorn/VirtualRPC | 9% |
| RPCEmu | 1% |
| Other | 3% |
Question 5: How long have you been a RISC OS user?
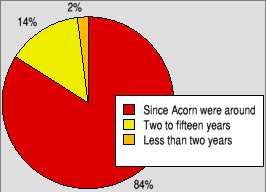
How long people have been RISC OS users.
| How long | Percentage |
|---|---|
| Since Acorn were around | 84% |
| Two to fifteen years | 14% |
| Less than two years | 2% |
Question 6: By choice, do you use any platforms other than RISC OS?
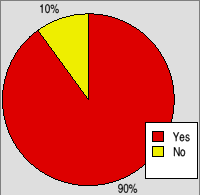
Whether people choose to use
another OS as well as RISC OS
| Yes or no | Percentage |
|---|---|
| Yes | 90% |
| No | 10% |
Question 7: If so, which operating system?
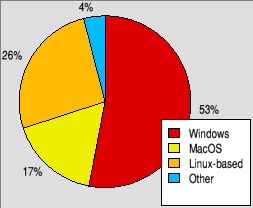
The other OS most used by choice.
| Most used other OS | Percentage |
|---|---|
| Windows | 53% |
| MacOS | 17% |
| Linux-based | 26% |
| Other | 4% |
Question 8: On what processor do you use that operating system?
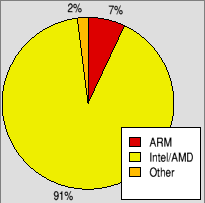
The processors used for the other
operating system.
| Processor used | Percentage |
|---|---|
| ARM | 7% |
| Intel/AMD | 91% |
| Other | 2% |
Question 9: And do you use it more than RISC OS?
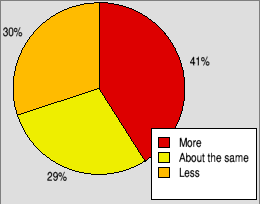
Is that other OS used more or less than RISC OS?
| Amount used | Percentage |
|---|---|
| More than RISC OS | 41% |
| About the same | 29% |
| Less than RISC OS | 30% |
Question 10: In which age range do you fall?
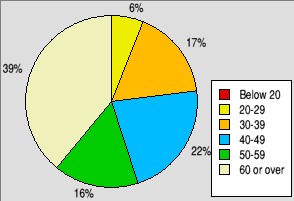
The age of RISC OS users.
| Age range | Percentage |
|---|---|
| Below 20 | 0% |
| 20-29 | 6% |
| 30-39 | 17% |
| 40-49 | 22% |
| 50-59 | 16% |
| 60 or over | 39% |
Question 11: Are you male or female?
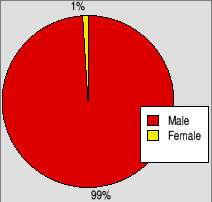
Are RISC OS users male or female?
| Gender | Percentage |
|---|---|
| Male | 99% |
| Female | 1% |